Open the analytics for any dynamic QR code and you will see two headline numbers: total scans and unique visitors. They rarely match, and the gap between them is often more useful than either number alone. This guide answers the questions people actually ask about unique QR code scans: what each metric counts, why the two drift apart, how the unique number is estimated, and which one to trust for a poster, an event feedback form, a restaurant menu or a product manual.
The short answer
Total scans count every time the code was opened. Unique visitors estimate how many different people did it. Use uniques for "how many people did this reach?" and totals for "how much is this being used?".
| Your question | Look at | Why |
|---|---|---|
| How many people noticed my poster or flyer? | Unique visitors | Repeat scans by the same person would inflate reach |
| Did my feedback form reach the room? | Unique visitors, next to form submissions | Uniques are the ceiling for how many people could have answered |
| Is my menu, manual or Wi-Fi card being used? | Total scans and the ratio between the two | Repeat use is the point, so it should show up |
| Is something wrong with my landing page? | A sudden gap between scans and uniques | People who can't load a page scan again |
| Which of two placements works better? | Either, as long as you compare like with like | Same metric, same date range, one code per placement |
Why are total scans higher than unique scans?
Because people scan more than once. A page loads slowly and they try again; a diner opens the menu at the start of the meal and again for dessert. Every one of those is a scan, but only the first one that day adds a unique visitor.
The unique count is also an estimate that can be off in both directions. Here are five real people over two days:
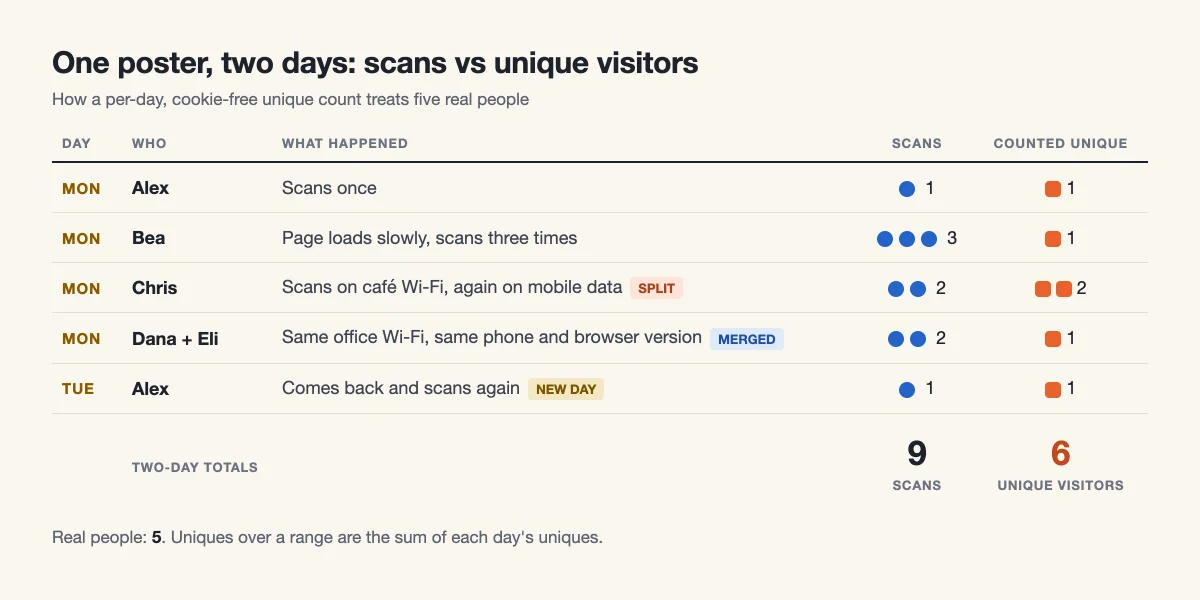
Nine scans, six counted unique visitors, five actual people. Bea's three attempts collapse into one visitor, which is what you want. Chris switched networks and was counted twice; Dana and Eli shared an office connection and identical phones and were counted once. Alex came back the next day and counted again, because uniques reset every day.
How are unique QR code scans counted?
There is no login when someone scans a printed code, so every tool has to estimate. On Dynamic QR Tool, the redirect turns each scan into a short visitor fingerprint: a one-way hash of the network address and the browser's user-agent string, combined with a secret key and the date. The first time a fingerprint appears for a code on a given day, it adds one unique visitor. The fingerprint lives only in server memory for that day and is never written to disk. No cookies are set and no IP addresses are stored. The dashboard says it plainly: "Unique visitors are estimated per day without cookies or stored IPs."
What that means in practice
- Uniques are per day. Over any date range, the unique figure is the sum of each day's uniques. A teacher who checks the same notice board code on five different days counts five times. Read a range figure as "visitor-days", not distinct people.
- Days are UTC. The daily reset happens at midnight UTC, which is late afternoon or evening across the Americas. An evening event in New York can straddle two counting days, so one person scanning at 7:30 pm and again at 8:15 pm Eastern can appear twice.
- Shared networks can merge people. Two people on the same Wi-Fi with the same phone model and browser version can produce the same fingerprint. iPhones on the same iOS version often send identical browser strings, so busy offices, schools and venues may slightly undercount.
- Switching networks or apps can split one person. Moving from Wi-Fi to mobile data changes the network address. Scanning once with the camera and once with a scanner app that opens its own in-app browser changes the browser string. Either way, one person can count twice.
- Some opens are not counted at all. Bots and link previews (for example when the short link is pasted into a chat app that fetches a preview) are excluded from both numbers, and scans of a paused code are not recorded.
These errors pull in opposite directions and matter most for long ranges and crowded places on one network.
Where to find both numbers
Every dynamic code has an analytics panel on its manage page. The top row shows scans and unique visitors for the selected range (7, 30 or 90 days, or all time); the three fixed ranges also show the change against the previous period of the same length. Below that, a chart shows scans as bars and unique visitors as a line.
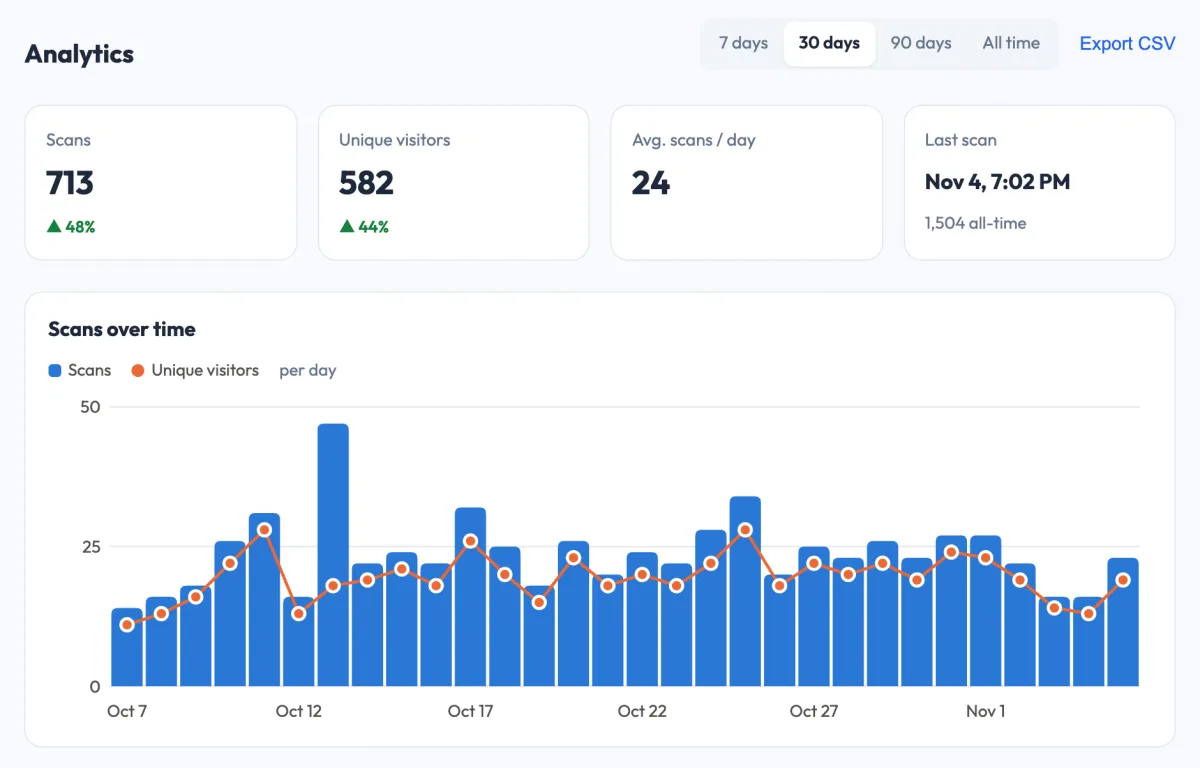
In this demo poster, October 13 stands out: almost 50 scans while the unique line barely moves. That shape is the signal worth investigating. The rest of the panel adds a day-by-hour heatmap and breakdowns by country, city, device, operating system, browser and language (hover a row for its unique visitors), plus a CSV export with scans and approximate unique visitors per day for each dimension. For a fuller tour of every chart, see how to track QR code scans.
Which metric matters? Five common situations
"How many people saw my poster?"
Use unique visitors. A poster's job is reach, and repeat scans by the same passer-by don't add any. If you put up several posters, give each location its own code on the poster QR code generator so you can compare daily uniques per spot. Uniques count people who scanned, not people who walked past.
"Did my event feedback form reach the audience?"
Use unique visitors, then put them next to the number of form submissions. If 120 people opened the form and 45 submitted, the problem is the form (too long, a sign-in wall), not the QR code. If only 30 opened it in a room of 200, the problem is visibility or timing. A code made with the event feedback QR code generator can also point to a new form for the next session without reprinting. For evening events in the Americas, check the daily chart for both dates, because of the UTC reset described above.
"Are people actually using my menu or manual?"
Here the total matters as much as the uniques. A table menu, a product manual or a Wi-Fi card is meant to be opened repeatedly, so a ratio of scans to uniques comfortably above 1 is a good sign. Keep the per-day rule in mind: a customer who returns next week counts as a new unique visitor, so the ratio shows repeat use within a day, not loyalty over months.
"Why did scans spike but uniques didn't?"
The same people scanned over and over. On a busy menu that can be normal. On a poster or flyer it usually means the page loaded slowly, showed an error or opened something unexpected, so people tried again. Open the link on a phone over mobile data and fix the destination; a dynamic code can be pointed elsewhere without reprinting. A pre-flight routine such as testing a QR code before printing catches most of these problems before launch.
"Which number goes in my report?"
Report both, and label them honestly: "scans" and "estimated daily unique visitors". If someone wants distinct people over a month, explain that a cookie-free count can't know that: the range figure is a sum of daily uniques.
Unique visitors tell you how far a code reached; total scans tell you how hard it is being used. The gap between them is the most honest diagnostic you have.
Reading the ratio between scans and uniques
- Close to 1. Most people scan once and move on. Normal for posters, flyers, direct mail and one-off signs.
- Clearly above 1, steady from day to day. Repeat use. Expected for menus, manuals, timetables and anything people keep coming back to.
- Normally close to 1, then a one-day jump. Something changed that day. Check the landing page, then whether a code was moved, covered or reprinted.
- Uniques higher than you expected. Over 90 days a regular visitor counts once per day. Switch to 7 days or export the CSV for daily figures.
There is no universal "good" ratio. Compare a code with its own history and with your codes in similar places, using the same metric and the same date range.
If you don't have a trackable code yet, create one for free on the Dynamic QR Tool generator. Both numbers start counting from the first scan, with no expiry and no scan limit.